TGE Listing Insights Key Takeaways
-An average of $291M in market cap was generated across the 109 benchmarked launches
-35 tokens used non-linear insider cliff unlocks, averaging 10.90% of the FD supply at the 12 month cliff unlock
-Teams are increasingly avoiding detailed disclosure of day-1 airdrop mechanics: only 80 projects shared these allocations and plans publicly
-Day-1 optical float consistently posted double-digit percentages, with a median return of 20.0%, though two projects recorded single-digit percentages
-Distribution splits for projects remain community-allocation focused, although 15 projects prioritized their insiders
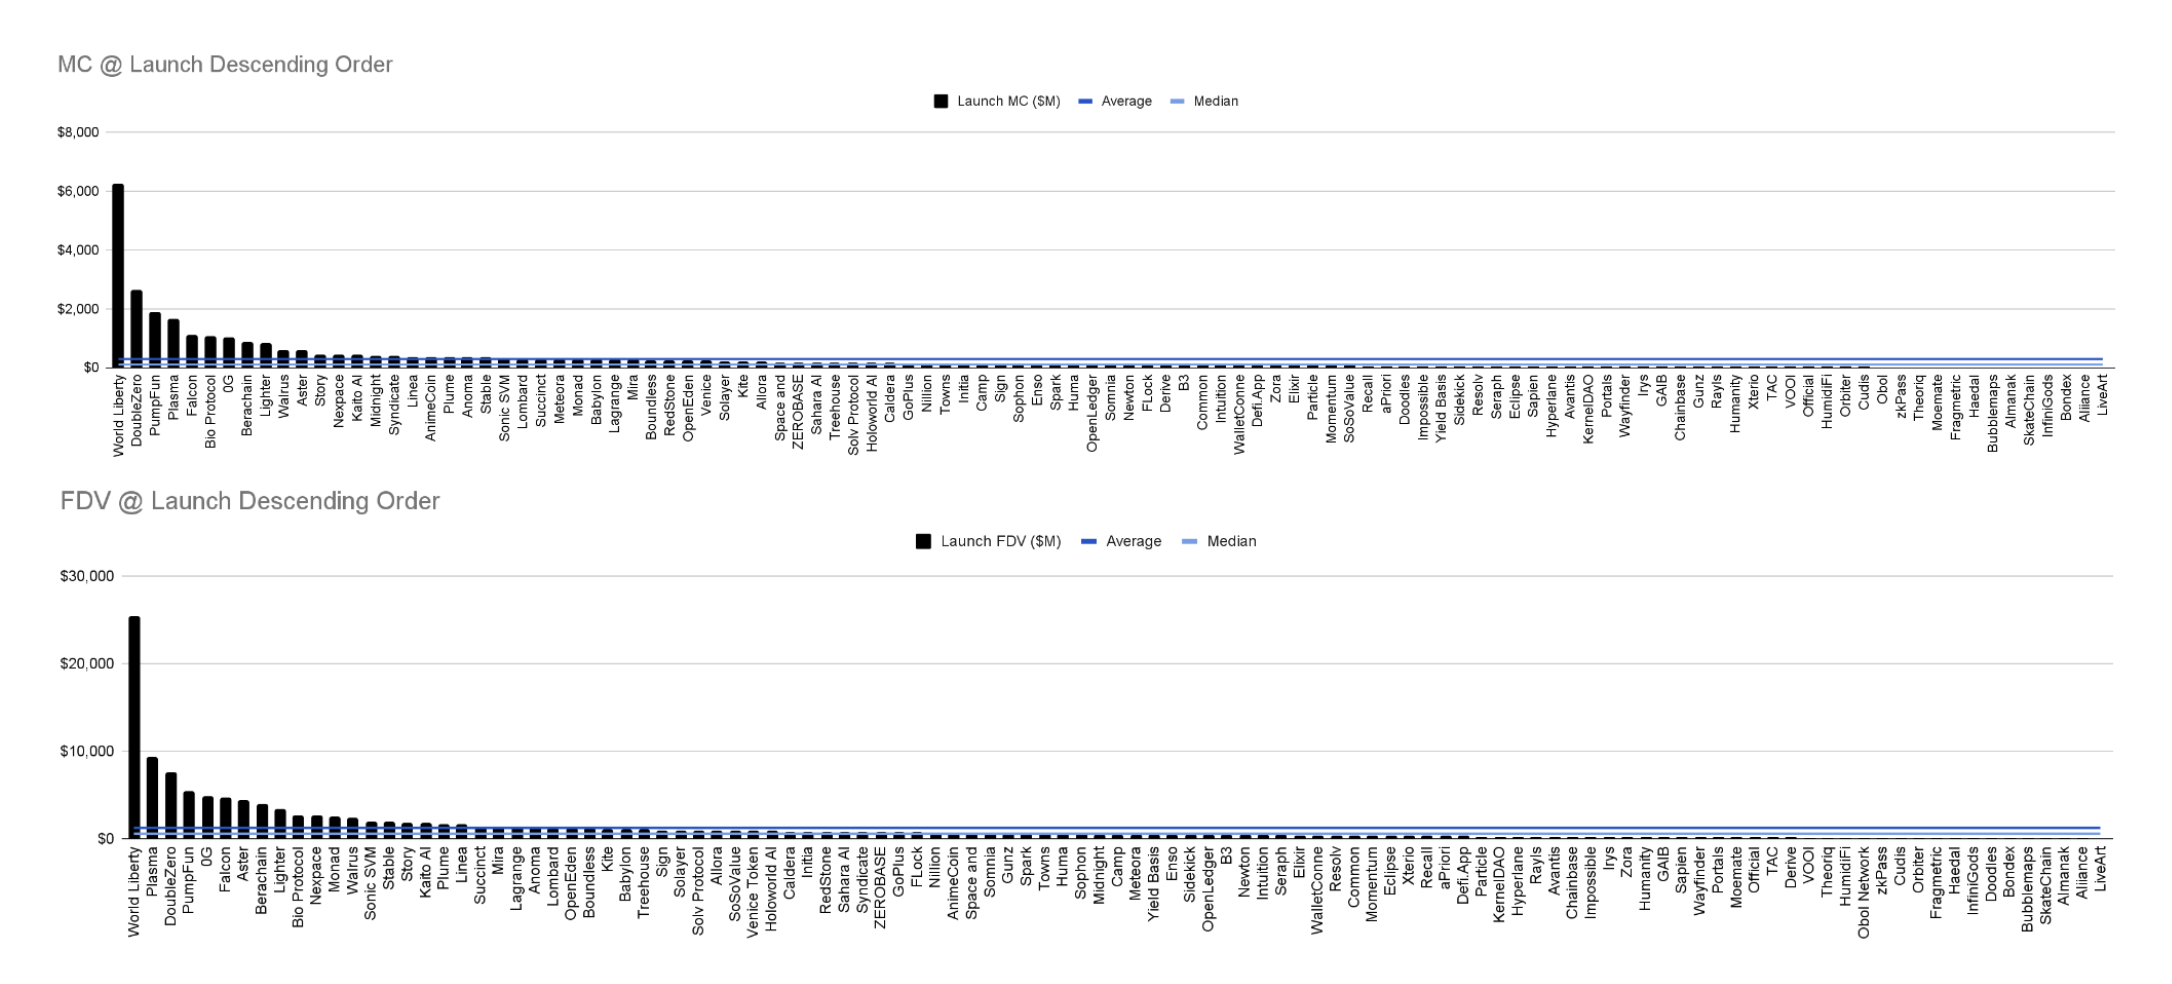
Individual TGE Metrics: MC & FDV @ Launch
In 2025, new token launches averaged a $291M MC (median: $105M) and a $1.3B FDV (median: $593M). Altogether, the 109 tracked launches created $138B in market value at TGE.
Individual TGE Metrics: Airdrop Allocation
Of the 109 benchmarked tokens, only 80 projects had public airdrop allocations. The average airdrop allocation across these projects was 12.26%, while the median was 10.00%.
%20Descending%20Order.png)
Individual TGE Metrics: Day 1 Optical Float
The average day-1 optical float was 21.99%, while the median was 20.00%. All projects except SoSoValue and Gunz posted double digit day-1 optical floats.
%20Descending%20Order.png)
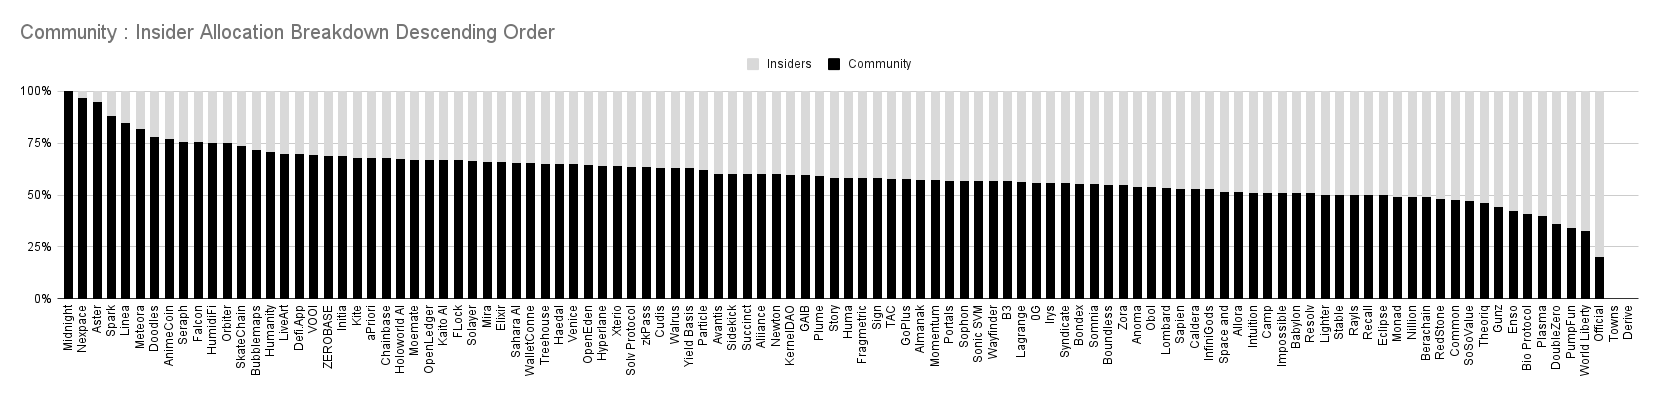
Individual TGE Metrics: Community vs. Insider Breakdown
87% of the benchmarked projects allocated at least 50% to the community, reflecting strong community-focused models. 15 projects prioritized their insiders.
Note: Towns and Derive did not disclose their allocations to the public.
Individual TGE Metrics: 12 Month Cliff Unlock
Of the 109 benchmarked tokens, only 35 projects had non linear 12-month cliff unlocks, with an average of 10.90% and median of 10.25%. These unlock mechanisms are often times detrimental to token performance as the cliff period approaches.
%20Descending%20Order.png)
This wraps up our valuation & TGE metrics analysis for 2025. Tune in shortly as we post our January 2026 CEX listing insights analysis.